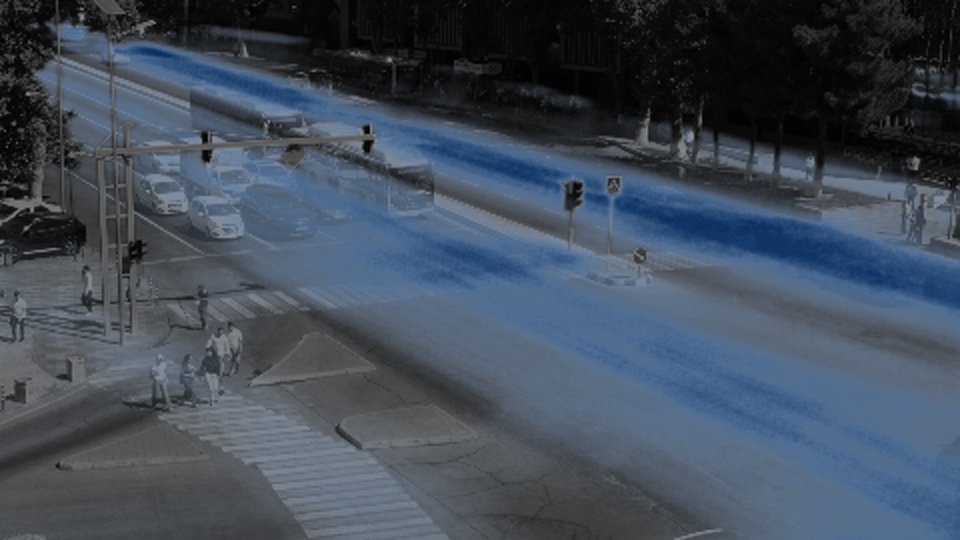
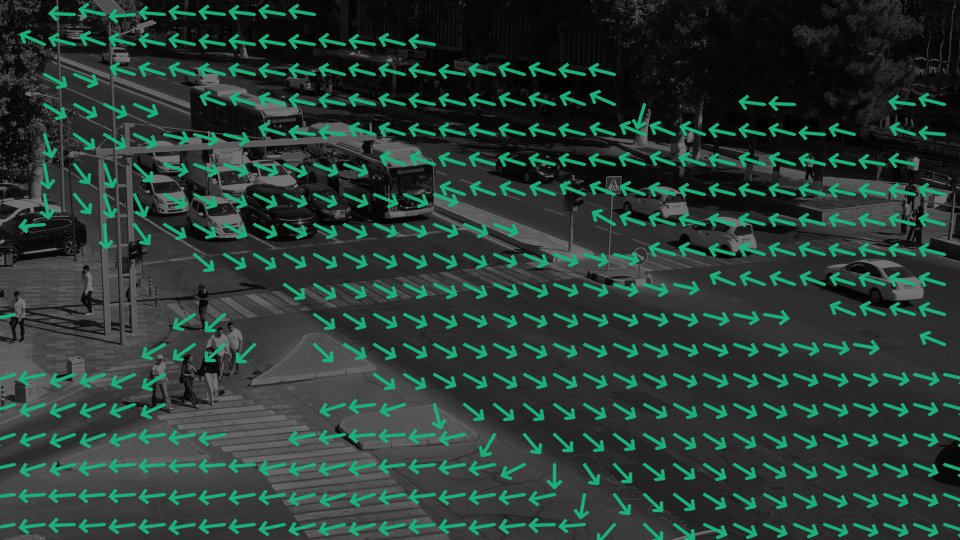
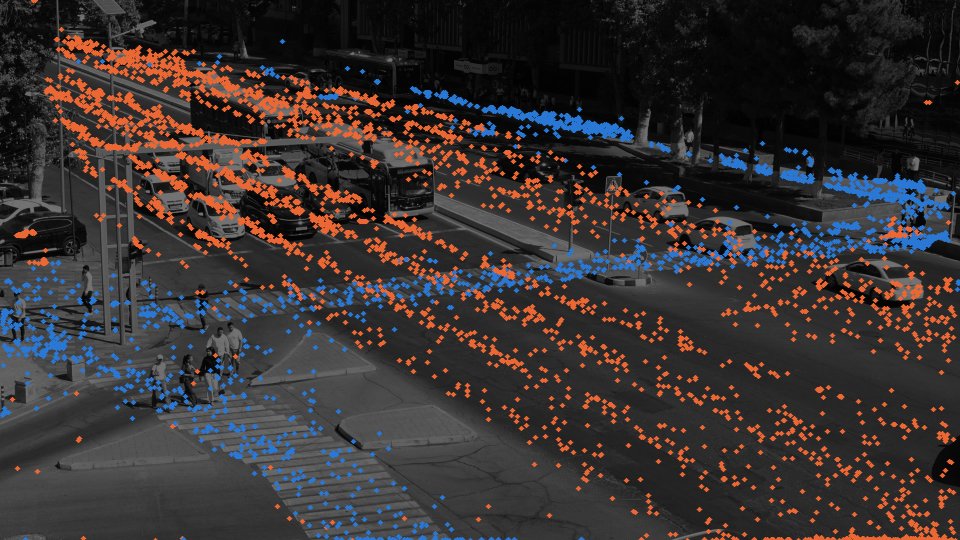
Exploratory data analysis
What the four sample clips told us
web/scripts/build_sample_data.py.Video properties
Every clip is 4K H.264 at 140 Mbit/s and 29.97 fps. The task text says 25 fps, so frame timestamps must come from the file's real rate, never an assumed one. At 4K, decoding alone is the main runtime cost. Lighting is not constant: mean brightness ranges from 45 to 96 across clips, so detection thresholds need checking on the darkest clip, not only the brightest.
| Clip | Resolution | fps | Length | Frames | Size | Brightness |
|---|---|---|---|---|---|---|
| C3896 | 3840×2160 | 29.97 | 340.3 s | 10,200 | 5.81 GB | 95 |
| C3897 | 3840×2160 | 29.97 | 317.8 s | 9,525 | 5.44 GB | 96 |
| C3902 | 3840×2160 | 29.97 | 317.8 s | 9,525 | 5.44 GB | 66 |
| C3905 | 3840×2160 | 29.97 | 127.6 s | 3,825 | 2.19 GB | 45 |
Traffic and pedestrians per clip
Detections per sampled frame from our fine-tuned YOLO. “Red seen” is the share of sampled seconds with at least one red signal head detected.
| Clip | Vehicles, mean | Vehicles, peak | People, mean | People, peak | Red seen | Moving area |
|---|---|---|---|---|---|---|
| C3896 | 29.3 | 43 | 16.2 | 30 | 55% | 3.9% |
| C3897 | 25.0 | 38 | 23.8 | 34 | 53% | 3.9% |
| C3902 | 30.4 | 47 | 27.6 | 44 | 49% | 4.2% |
| C3905 | 32.7 | 42 | 24.0 | 42 | 63% | 2.9% |
Finding: the “fixed” camera is not pixel-identical across clips
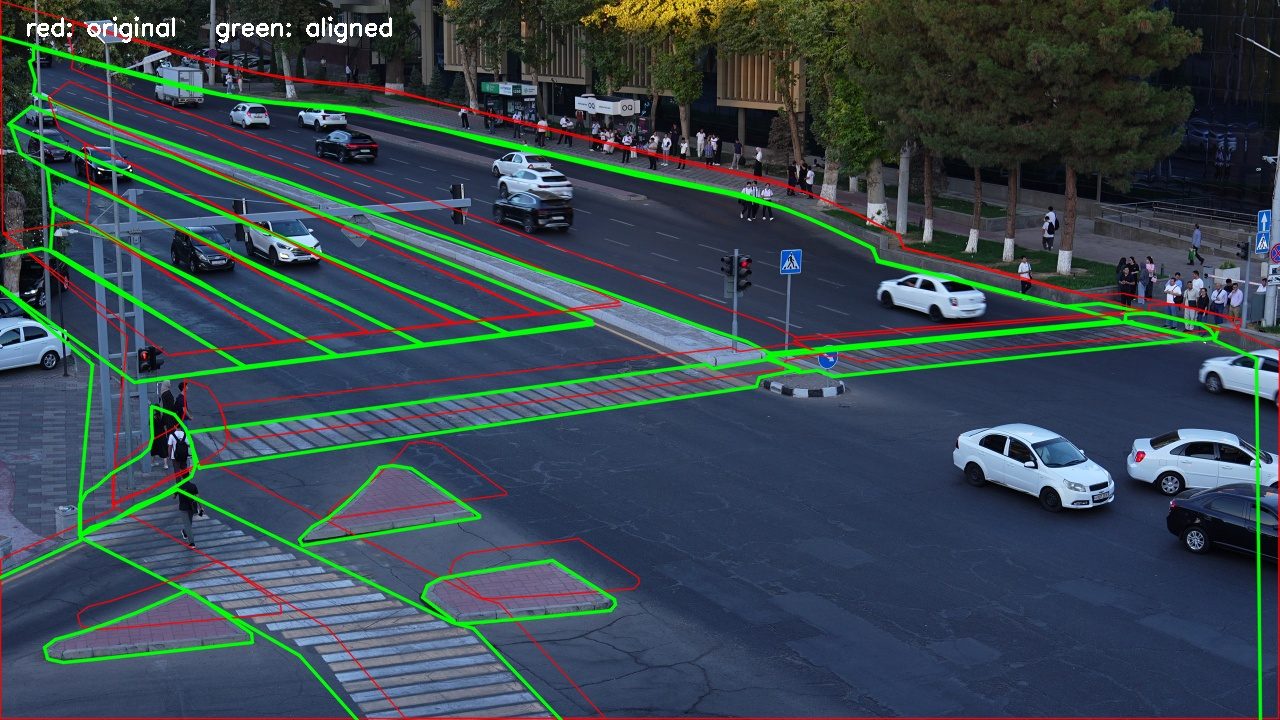
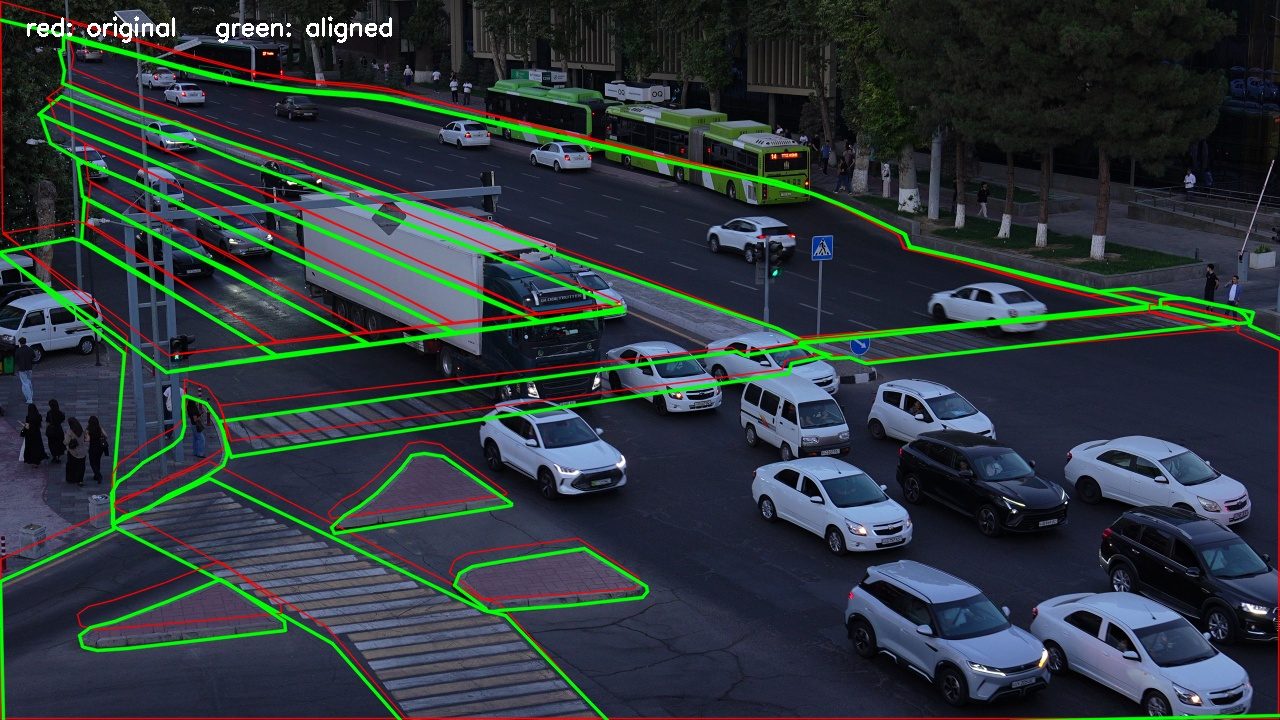
Our scene polygons (lanes, stop lines, crossings, island) were drawn on C3897. On C3902 the same features sit 38 px away at 1280×720, about 115 px in the original 4K. Unaligned crossing polygons overlap the aligned ones by only 27–47% on C3902, and in a spot check alignment changed the crossing membership of 111 of 361 person detections, so point-in-zone rules would have fired in the wrong place. We now estimate one homography per video from stationary SIFT features before any rule runs.
| Clip | Residual before | Residual after | Transform used |
|---|---|---|---|
| C3896 | 0.29 px | 0.22 px | Identity |
| C3897 | 0.21 px | 0.17 px | Identity (reference clip) |
| C3902 | 38.35 px | 0.38 px | Homography |
| C3905 | 15.04 px | 0.40 px | Homography |
Per-clip time series and heatmaps
Counts by class over time, signal phases, lighting, motion, lane directions and where road users actually walk and drive.
Road users over time
Detections per frame every 2 s (fixed_names.pt, 1280 px, confidence ≥ 0.25). Counts are detections, not unique objects. Click a name to hide it.
Traffic-signal phases
Seconds where the detector saw a red or green signal head. Several heads are visible at once, so both rows can be on together. This is what red_light and stop_line rules key on.
Lighting
Mean frame brightness (luma, 0–255).
Motion
Share of the image that changed between frames (frame differencing, ~10 fps).